Note
Go to the end to download the full example code.
Extension Zone Demo
Extension zones are a bit fiddly in PySALESetup. They need to be created before the mesh object and fed in as arguments.
They must always be accompanied by an ExtensionZoneFactor as well which dictates how much they alter the cell size by.
from PySALESetup import PySALEObject, PySALEMesh
from PySALESetup.mesh import ExtensionZone, Region, \
    ExtensionZoneFactor
import matplotlib.pyplot as plt

# Construct 4 extension zones: one for each region
extension_zones = [ExtensionZone(15, region, 1.,
                                 ExtensionZoneFactor(1.05, 20))
                   for region in [Region.NORTH, Region.SOUTH,
                                  Region.EAST, Region.WEST]]

# Build a mesh using the extension zones
m = PySALEMesh(100, 100, extension_zones=extension_zones,
               cell_size=1.)
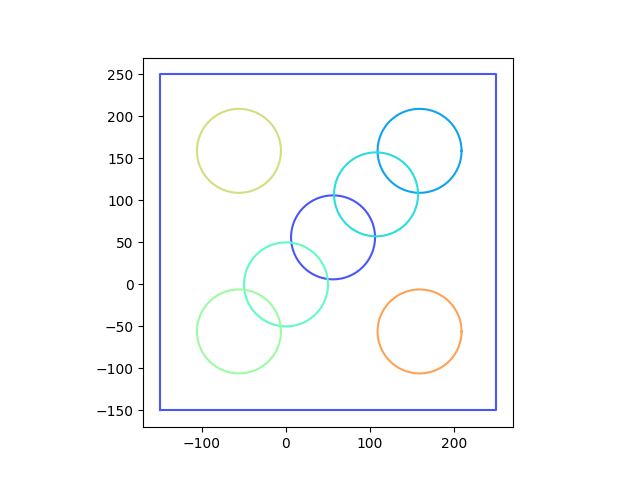
We create a dummy host to help visualise the problem, but we won’t use it.
host = PySALEObject([(-150, -150), (-150, 250), (250, 250), (250, -150)])
object1 = PySALEObject.generate_ellipse([56, 56],
                                        50., 50., material=1,
                                        rotation=0)
object2 = PySALEObject.generate_ellipse([159, 159],
                                        50., 50., material=2,
                                        rotation=0)
object3 = PySALEObject.generate_ellipse([107.2, 107.2],
                                        50., 50., material=3,
                                        rotation=0)
object4 = PySALEObject.generate_ellipse([0, 0],
                                        50., 50., material=4,
                                        rotation=0)
object5 = PySALEObject.generate_ellipse([-56, -56],
                                        50., 50., material=5,
                                        rotation=0)
object6 = PySALEObject.generate_ellipse([-56, 159],
                                        50., 50., material=6,
                                        rotation=0)
object7 = PySALEObject.generate_ellipse([159, -56],
                                        50., 50., material=7,
                                        rotation=0)
for ob in [object1, object2, object3, object4, object5, object6, object7]:
    host.add_child(ob)

host.plot()
plt.show()
Project the circles onto our new mesh and plot the result.
m.project_polygons_onto_mesh(host.children)

f, ax = m.plot_materials()
# NB x_range and y_range are cell centres, not cell edges!
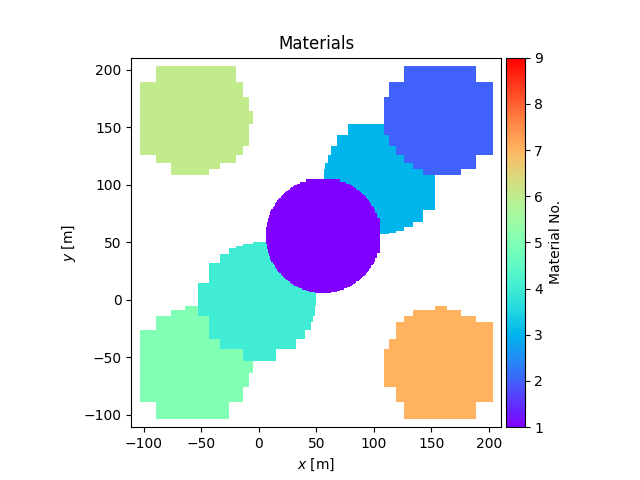
This final step adds lines to cell centres, which makes it easier to see how the extension zone regions work.
for item in m.x_range:
    ax.axvline(x=item, lw=0.2, color='m')
for item in m.y_range:
    ax.axhline(y=item, lw=0.2, color='m')

plt.show()
Total running time of the script: (0 minutes 0.792 seconds)